
Buffon's Needle: A really weird way to find Pi
Pi (π) refers to the ratio of Circumference to diameter of any circle. It's a constant value (unless you are trying to measure π from inside the Event horizon of a Blackhole!). It's also a transcendental number which means it can't be expressed as a root of an equation with integer coefficients. Anyways, we've been able to find the value of π over 9 trillion digits after the decimal point!

The history of our attempt to find π goes back to Archimedes' time. He tried to calculate π using a 4096 side polygon! Without any calculator, he was able to find that the value of π should lie between 3.1429 and 3.1408.
Discovery of Calculus in the 17th century opened a new window for estimating π more precisely. Since then, we've seen plenty of methods to do it. Some of them are pretty weird but simple enough to understand. Buffon's Needle Problem is one of them. This problem was first posed by the French Naturalist Georges-Louis Leclerc, Comte de Buffon in 1733. It goes like this:
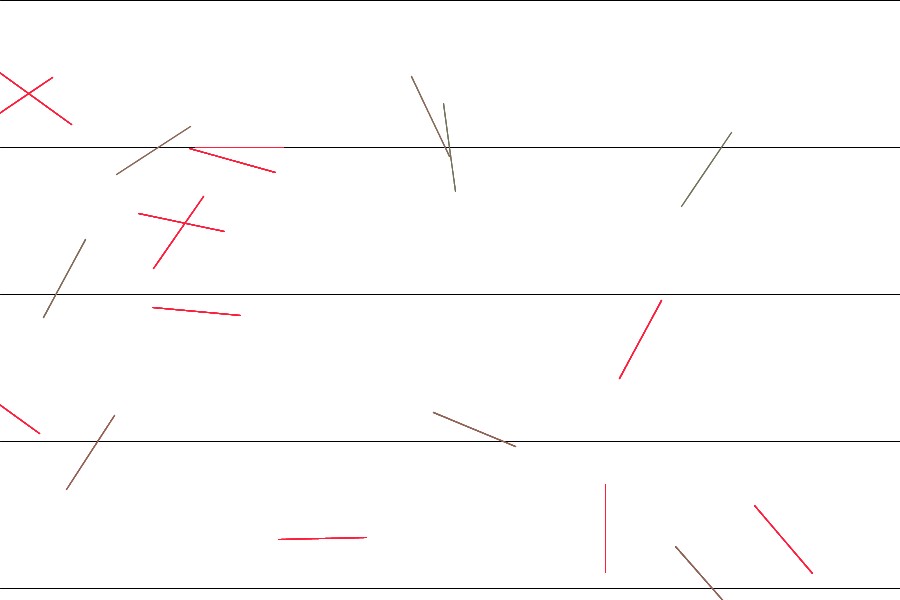
Suppose you are given a floor with equally spaced parallel lines on it. If we drop a needle on the floor, what is the probability that the needle will lie across a line?
Let's say you've thrown n needles (or a single needle for n times or whatever). m number of needles cross/intersect with a line (or m times if you have one needle 😛). The probability P that a needle crosses the line:
It may seem a bit odd how π is related to this problem. Hang on tight. I'll explain.
To solve this problem, we'll require some basic knowledge of Probability and Integral Calculus. Let's assume that the spacing between two consecutive parallel lines is D, the length of the needle is L. Now, let the distance from the middle point of a needle on the floor to its closest line be x and the acute angle between the line and needle be θ (See figure above). All needles are of equal length.
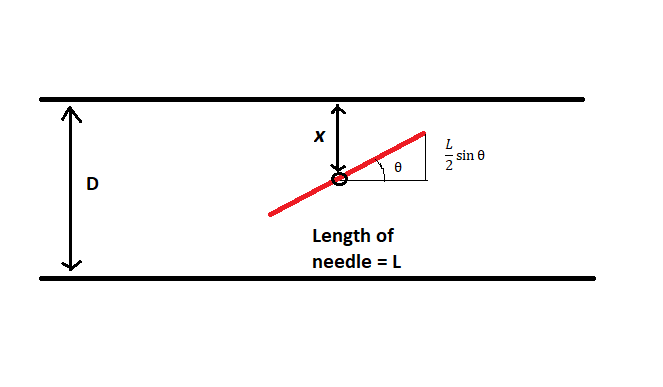
Since we are considering x to be the smallest distance from the center of the needle to any one of the lines, it can vary only within 0 and D/2. And since θ is an acute angle, it can take any value between 0 and π/2. Using trigonometry, we can find out that the vertical component of length L is \( \frac{L}{2} \sin(\theta) \). The needle will cross the line if x is less than \( \frac{L}{2} \sin(\theta) \).
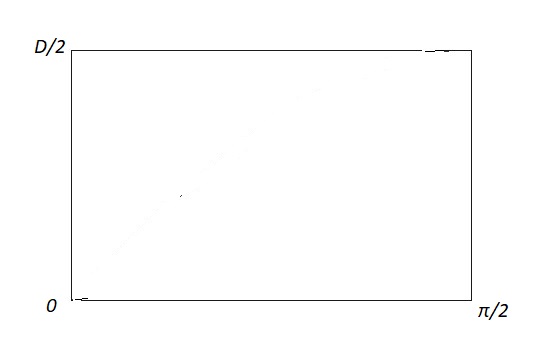
Okay. Now let's visualize possible outcomes in a graph. Let the horizontal axis be θ and the vertical axis be x. So a rectangle with sides \( \frac{\pi}{2} \) and \( \frac{D}{2} \) represents all possible outcomes in this experiment.
Now I am going to shade all those points in the rectangle that represent the events where a needle crosses a line according to the two conditions above. Think about it. It's just the area under the curve \( \frac{D}{2} \sin(\theta) \) where \( 0 \leq \theta \leq \pi \).
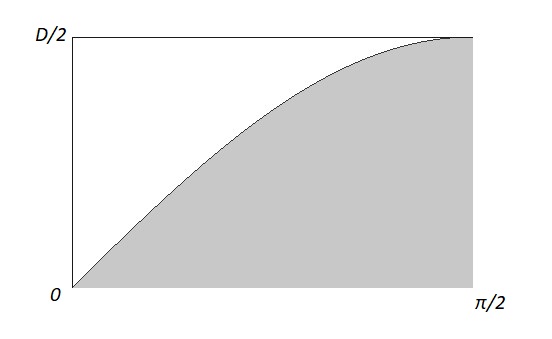
The probability we are looking for would be the ratio of the area under the sine curve and the rectangle.
Area of the rectangle: \[ \frac{\pi D}{4} \]
Area under the sine curve: \[ \int_0^{\pi/2} \frac{L}{2} \sin(\theta) \, d\theta = \frac{L}{2} \]
Ratio of the areas: \[ \frac{\frac{L}{2}}{\frac{\pi D}{4}} = \frac{2L}{\pi D} \]
Rearranging, we get \[ \pi = \frac{2L}{P D} \]
In 1901, Italian mathematician Mario Lazzarini performed Buffon's needle experiment and, tossing a needle 3408 times, obtained π up to six decimal points correctly!
I myself created a simulation to do this experiment. You can see it below. It's throwing 'imaginary' needles on an 'imaginary' floor with parallel lines and calculates π based on the formula derived above. You can press RIGHT ARROW to speed in up. Enjoy experimenting!